

Investor Ecosystem: Snapshot & Shifts
The investment ecosystem after the correction
The investment landscape in 2026 looks materially different from 2022. The original analysis was written near the peak of an unprecedented funding boom; what followed was the continent’s most significant funding contraction in the modern African startup data series.
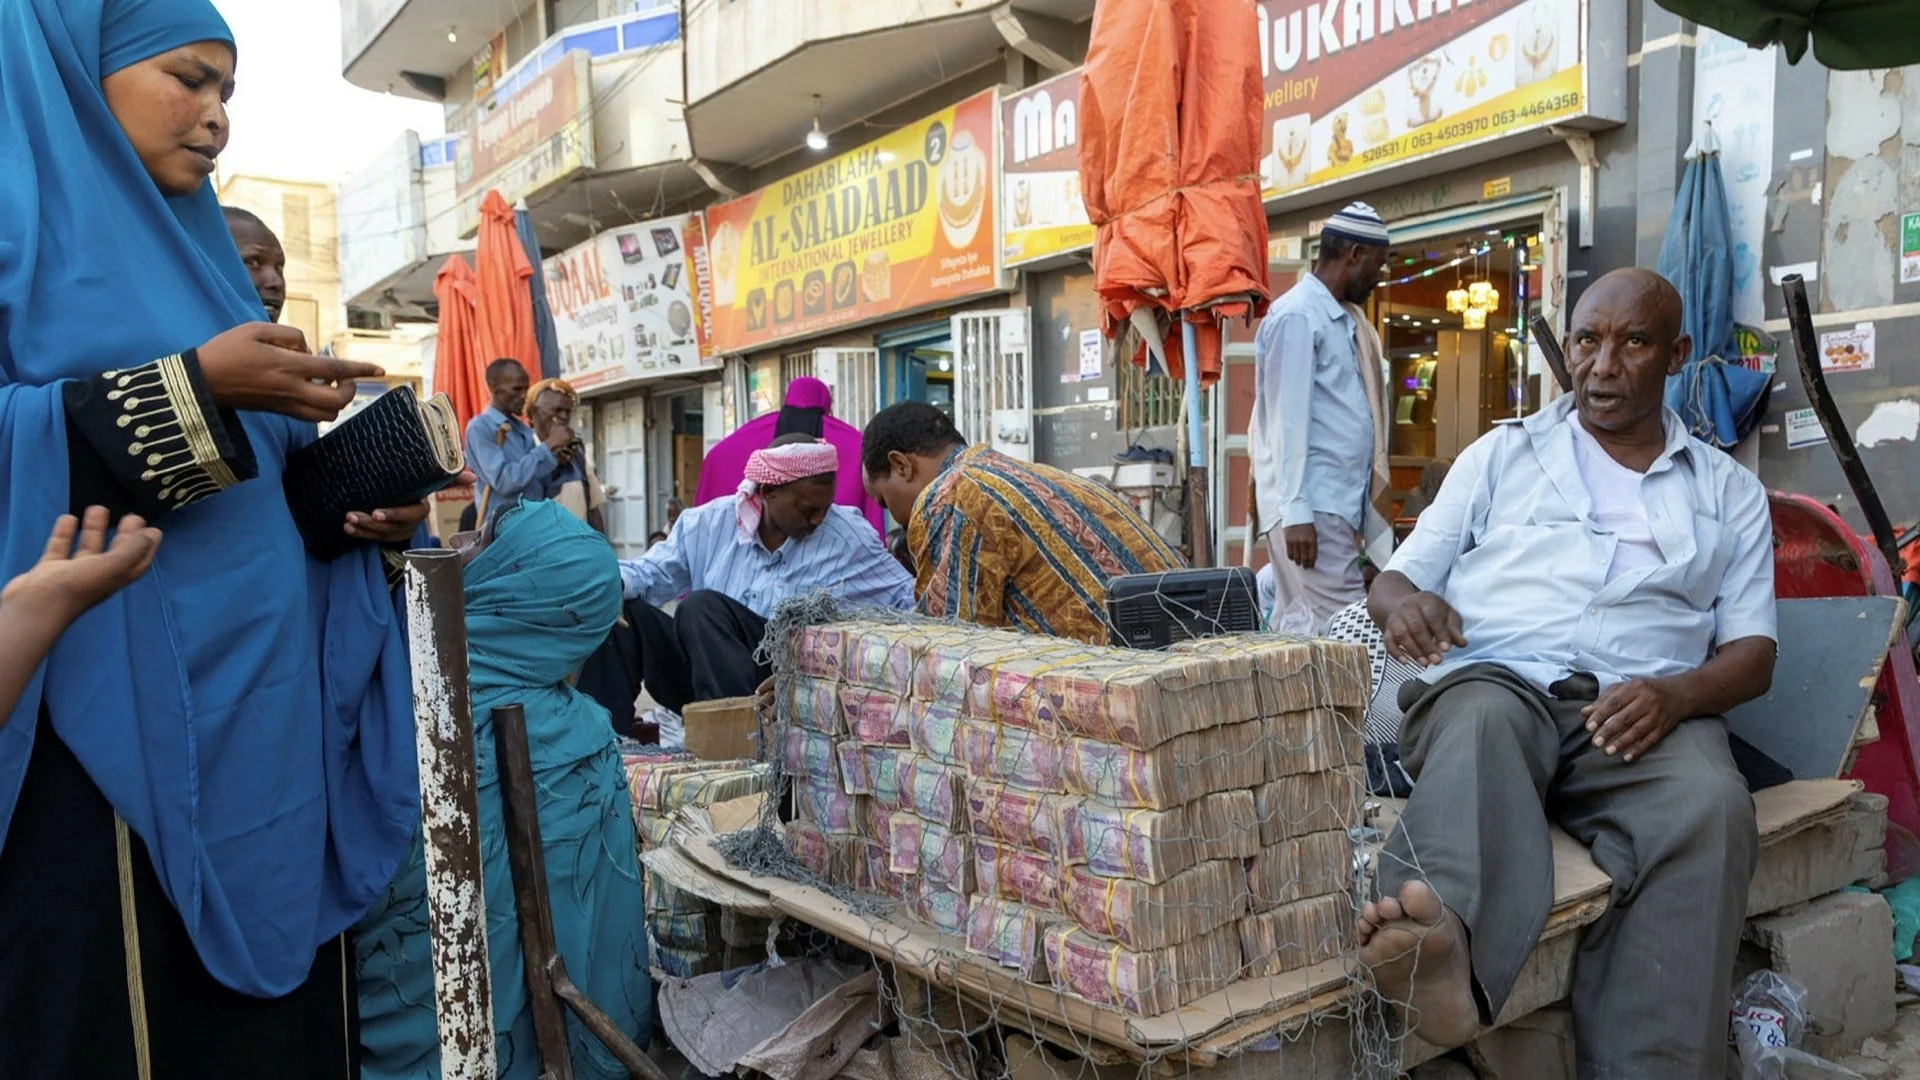
The trajectory in data: Africa attracted just 0.6 percent of global venture capital in 2024, according to the Mo Ibrahim Foundation's Financing the Africa We Want report - a continent that represents 18 percent of the world's population and 5 percent of global GDP. On the Africa: The Big Deal / Mo Ibrahim datasets, African startup equity funding rose from $1.4 billion in 2019 to a peak of $4.6 billion in 2022, before falling to $1.5 billion in 2024. Partech’s broader African tech VC dataset records a higher 2024 figure - $3.2 billion across equity and debt, including $2.2 billion in equity - reflecting different methodologies and coverage. In Disrupt Africa’s funded-tech-startup dataset, the number of active investors fell from 987 in 2022 to 330 in 2025, while the number of funded startups fell to 178. The market has not simply cooled; it has narrowed.
The structural foundation for understanding why this matters sits in the modern empirical economics of financial constraints. Beck, Demirgüç-Kunt and Maksimovic's Journal of Finance paper "Financial and Legal Institutions and Firm Size" - drawing on World Bank Enterprise Surveys data across 54 economies - established the foundational empirical pattern: ventures not facing credit constraints grow significantly faster than those that do, and the growth gap concentrates at exactly the scaling-stage transitions where capital architecture mismatch is most consequential. The implication for the post-correction landscape is direct: the trajectory in the data above is not just market sentiment recalibrating. It is the constraint on African scaling-venture growth tightening at a structural level the architecture was already poorly calibrated for.
Two concurrent annual reports document 2025 African tech funding, arriving at different totals through different methodologies. Partech's 2025 Africa Tech Venture Capital Report records $4.1 billion in total funding - $2.4 billion in equity across 462 deals and a record $1.64 billion in debt across 107 transactions, up 63 percent year on year and accounting for 41 percent of all capital deployed. AVCA's 2025 Venture Capital Activity in Africa report records $3.9 billion across 506 deals, with venture debt reaching $1.8 billion - up 91 percent - representing 47 percent of total value, while equity fell 21 percent to $2.1 billion. The gap between providers reflects differences in deal-size threshold, instrument classification, and disclosure coverage rather than disagreement about underlying market activity. Both reports confirm the same structural reality: debt has become a mainstream financing layer, domestic investor participation reached a record high, and equity growth was modest. This publication draws on both throughout; figures are attributed to their source at each point of use.
The ecosystem is not returning to 2021. It is maturing structurally on a more demanding foundation.

The correction's structural effects
The correction was not a cyclical episode. It revealed structural vulnerabilities that will take years to address.
The Series A cliff became dramatically more visible. Partech’s 2025 data show that the 2019 Seed+ cohort reached 23.8% conversion to Series A within three years, while the 2021–2023 Seed+ cohorts achieved only 5.5%–6.5% conversion over the same horizon. The substantive treatment of why the contractual architecture of African Series A rounds - anchored in Kaplan-Strömberg on VC contracts and Lerner-Schoar on emerging-market contractual practice - produces this structural vulnerability sits in The Financing Journey Through the Scaling Phases. The implication for the empirical landscape is that the ventures that fell into the gap between Series A and growth capital were the primary casualties of the correction period. This is a market failure, not a founder failure.
Capital concentration increased rather than decreased. Kenya, South Africa, Egypt, and Nigeria accounted for 72 percent of total funding in 2025, up from 69 percent in 2024. The Mo Ibrahim Foundation's Financing the Africa We Want report sharpens this: 84 percent of 2024's VC funding went to these four countries alone. The substantive treatment of why this geographic concentration is structurally self-reinforcing - anchored in Myrdal's cumulative causation and Krugman's New Economic Geography - sits in Spatial Scaling Dynamics. Capital continued to flow to established ecosystems where investor networks, legal infrastructure, and venture track records are most developed. Francophone markets and smaller economies remained severely underrepresented.
Sector composition diversified. Partech’s 2025 sector data show a broader funding mix: fintech’s equity share fell sharply, cleantech rose strongly, and enterprise software, e-commerce and healthtech each crossed meaningful annual equity thresholds. The top five sectors still absorbed 86 percent of all funding, but the composition broadened.
The domestic investor shift: the most important structural development
The most consequential structural development in the 2025 data receives insufficient attention in the headline numbers. AVCA’s 2025 data show local capital remained central, with African investors comprising one-third of all active participants in venture deals for the second consecutive year. LumiBrief’s analysis of the AVCA data suggests an even more significant shift in fund commitments, with African domestic investors accounting for a much larger share than in 2022–24. That shift matters, but the composition needs scrutiny: African corporates and DFIs are not the same as commercial pension funds or family offices. One caveat from LumiBrief's analysis of the AVCA data deserves naming directly: the 45 percent domestic figure requires closer examination of who exactly is being counted as a domestic investor.
This represents a structural reduction in the ecosystem's dependence on external sentiment cycles. The domestic investor shift, if it consolidates, addresses that fragility at source. The composition matters as much as the volume: the surge is led by African corporates and DFIs rather than commercial pension funds or family offices, whose investment mandates do not necessarily align with the patient, long-term capital scaling ventures most need.
One caveat from LumiBrief's analysis of the AVCA data deserves naming directly: the 45 percent domestic figure requires closer examination of who exactly is being counted as a domestic investor. African corporates driving the shift include large telecommunications companies and financial institutions whose investment mandates do not necessarily align with the patient, long-term capital that scaling ventures most need. The substantive treatment of how DFI mandates and governance shape investor behaviour - and the broader political-economy analysis of who deploys African capital and on whose terms - sits in Institutional Actors and The Political Economy of Capital. The direction of travel in the empirical landscape is genuine; the architecture-of-deployment analysis sits at those substantive treatments.

Debt as a structural fixture
In Partech’s dataset, debt has moved from a peripheral instrument in 2019 to a central part of the African tech capital stack: by 2025, debt reached $1.64 billion across 107 transactions, representing 41 percent of total capital deployed.
The DFI architecture deploying this debt has consolidated visibly. British International Investment announced its 2026–31 strategy in April 2026, with public reporting describing a target of around £9 billion of capital for Africa as part of a wider £15 billion mobilisation/investment ambition for developing economies. The strategy also raises climate-finance and gender-lens targets. FMO, the Dutch entrepreneurial development bank, invests in more than 85 countries and maintains African offices in Johannesburg and Nairobi. Its Strategy 2030, “Pioneer – Develop – Scale,” and FMO Ventures programme position it as a major DFI actor in venture-stage and growth-market finance. The institutional architecture matters because it concentrates: every African Series A recorded in the first two months of 2026 involved at least one DFI or state-backed investor, and the BII-FMO-Proparco-IFC-DEG cluster is now the structural backbone of African growth-stage equity. The substantive treatment of how DFI mandates shape what gets funded - and the September 2025 Bond review of BII that names tensions in the institution's evolution toward private-capital mobilisation - sits in Institutional Actors.
The limitations of debt as a structural fixture are clear. Most facilities remain USD-denominated, while revenues are generated in local currencies. The substantive treatment of original-sin currency mismatch - anchored in Carstens and Shin's foundational work on emerging-market corporate debt - sits in From Structure to Operations and The Financing Journey Through the Scaling Phases. Currency depreciation during the correction translated into repayment stress for firms earning in local currencies but servicing USD debt, and likely contributed to higher default pressure in markets such as Nigeria and Kenya. Local-currency structures - such as those seen in Sun King and Wave - demonstrate what is possible, but remain rare. Without shifts in currency denomination, tenor, and covenant design, debt risks stabilising firms in the short term while increasing long-term vulnerability.

M&A: volume doubled, character changed
Exit activity increased in 2025, with 34 venture-backed exits recorded - a 31 percent rise year-on-year according to AVCA. Africa-based buyers accounted for 54 percent of transactions, the highest domestic share to date, and trade sales represented over 70 percent of both volume and value.
The structure of exits has shifted. Consolidation between ventures operating in similar markets - such as the Wasoko-MaxAB merger, the substantive treatment of which sits in The Scaling Decision Log and Platform Models - reflects a move toward scale through combination rather than independent growth. These transactions often arise where firms cannot individually reach the scale required for profitability under tighter capital conditions.
This is a different exit pathway from the global-acquisition model that dominated earlier expectations. In some cases, consolidation reflects strategic alignment. In others, it reflects constrained alternatives, particularly where upstream growth capital is limited.
The M&A market is developing, but its current form is shaped by capital constraints rather than purely by strategic expansion. Exit pathways remain closely tied to the availability of growth-stage funding.

The Series B cliff: the ecosystem's most consequential structural gap
The growth-stage financing gap is now the most visible structural constraint in the ecosystem. The number of investors able to lead $15–30 million rounds - with the required sector expertise, risk tolerance, and deployment capacity - remains limited. When ventures fall outside these parameters, capital access drops sharply.
Recent data reinforces the pressure points. In Q1 2026, African startups raised $554 million across 58 deals, with activity concentrated among DFIs and established late-stage funds. Early-stage investment remains constrained, raising forward-looking concerns about the strength of the future pipeline.
This creates a discontinuity. Firms progress through early stages and then encounter a break in the capital stack at the point where scaling requires larger, riskier investment. The consequences are visible in stalled growth, forced consolidation, and increased reliance on non-equity financing. The Beck-Demirgüç-Kunt-Maksimovic empirical pattern introduced earlier names the structural cost: the growth gap between credit-constrained and unconstrained ventures concentrates at exactly the scaling-stage transitions where the African Series B cliff now operates. The Series B gap is not an isolated issue. It shapes the behaviour of the entire ecosystem - from how firms grow to how exits occur.

Traditional lenders remain cautious
Commercial bank lending remains structurally limited. African SMEs face an estimated annual financing gap of roughly $300–331 billion, while information asymmetry, collateral requirements and high cost of capital continue to exclude many growth-oriented firms from bank finance. Alternative models are emerging. Revenue-based financing approaches, such as those used by Untapped Global, align repayment with performance and are particularly suited to asset-heavy sectors including agriculture, manufacturing, and clean energy. These models expand the range of available instruments, but remain niche relative to system-wide demand.
There is no shortage of technical solutions. Frameworks such as the INVEST SME Banking Toolkit - developed by Dalberg, ConsumerCentriX, and Global Steering Group for Impact Investment with support from Argidius Foundation and Growth Firms Alliance - provide clear guidance on building viable SME lending portfolios. The constraint is adoption. Incentives, risk models, and institutional capabilities within banks have not shifted sufficiently to translate these approaches into scale.